
Troubleshooting issues
Whenever executing GraphQL queries via the Internal GraphQL Server or via Automation, and the output is not the expected one, we can find out what's wrong by checking the logs.
Getting notified when a query fails
By default, whenever an 🔴 Error entry is added to the logs, a notification badge will be displayed in the plugin menu.
This will inform us that the execution of a GraphQL query has failed, and prompts us to browse the logs.
Finding the problem
Browse the logs. If you find an 🔴 Error, that's certainly where the problem is.
If you find a 🟡 Warning, then the query found an unexpected condition, which may be the source of the problem.
For instance, if an automation was not executed, the log will contain an entry with the its status and data.
In this screenshot, a log entry with an 🔴 Error helps us understand that the variables provided to the query in the automation are not valid:
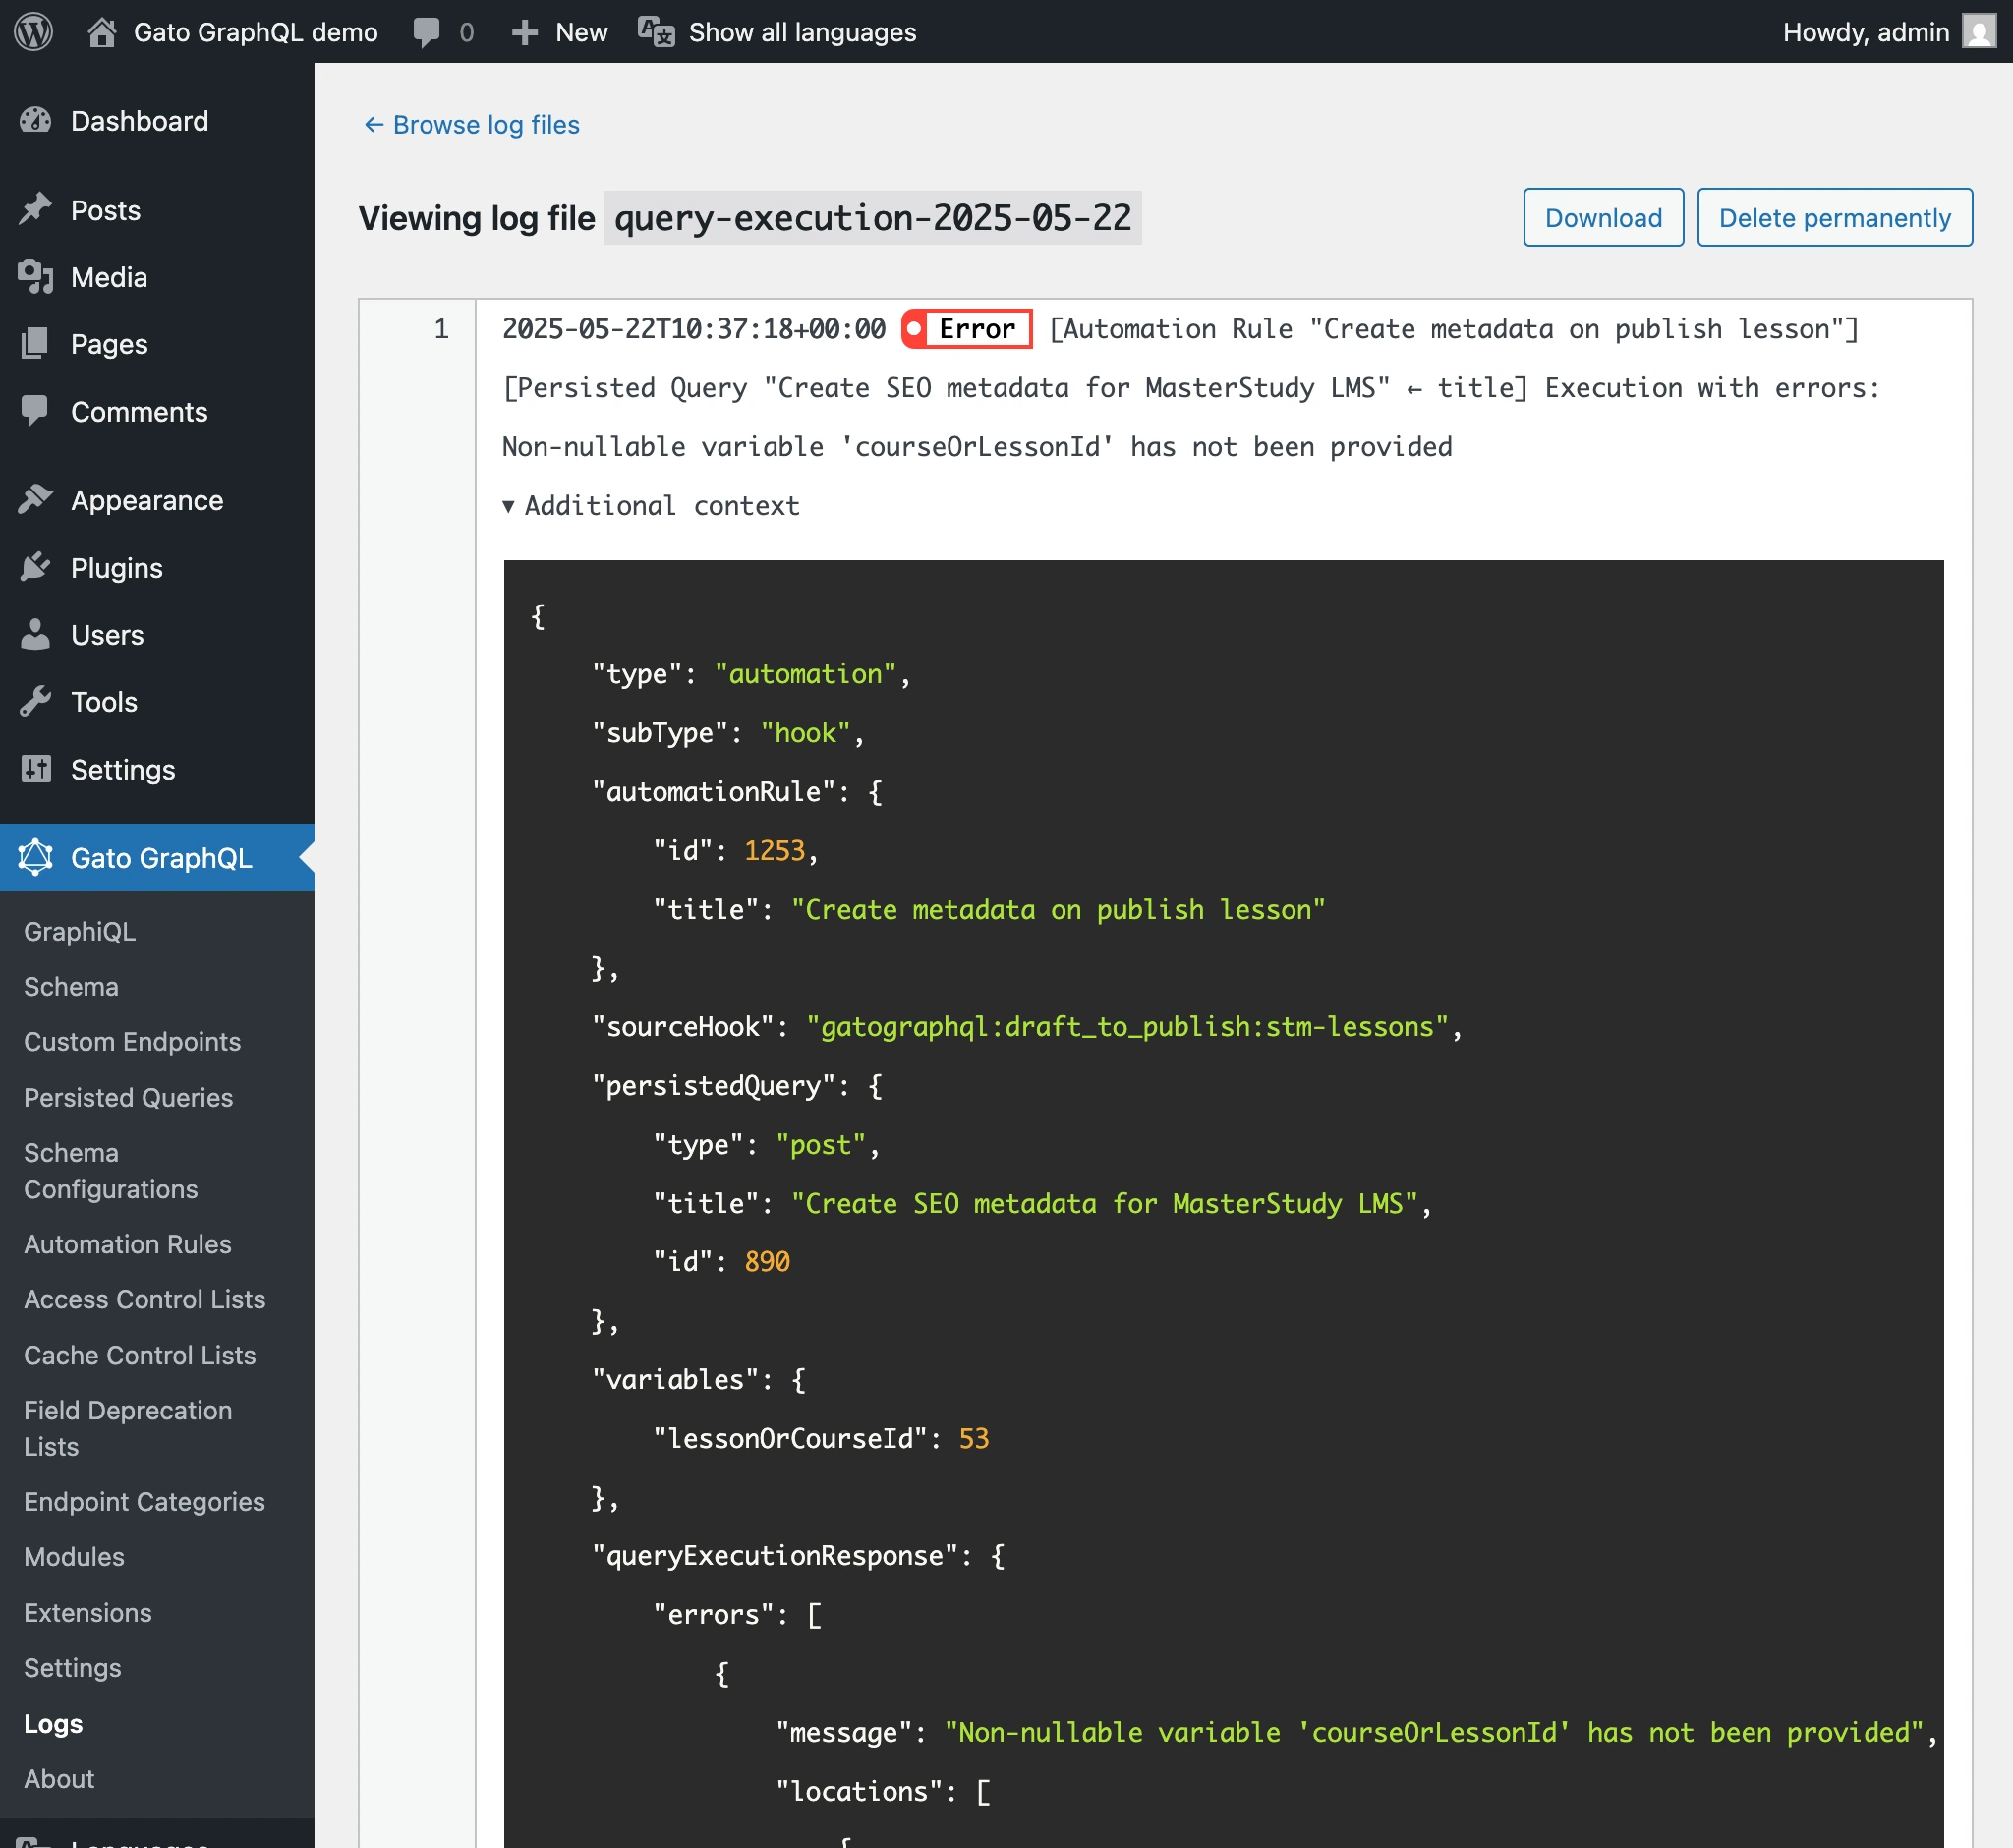
The log entry reads:
🔴 Error [Automation Rule "Create metadata on publish lesson"][Persisted Query "Create SEO metadata for MasterStudy LMS" ← title] Execution with errors: Non-nullable variable 'courseOrLessonId' has not been providedThen, the issue is that the name of the variable defined in the automation is wrong (lessonOrCourseId was defined in the automation, but in the persisted query it's called courseOrLessonId).