
Accessing Logs & Notifications
Logging can be enabled to visualize the data involved in the execution of GraphQL queries, including:
- Name of the query
- Variables provided to the query
- Execution response
- Additional context (error message, etc)
The logs are stored under the wp-content/gatographql/logs folder.
Logs are available only when an extension can make use of it, including:
- The Internal GraphQL Server extension logs the queries executed.
- The Automation extension logs the queries executed by the persisted queries triggered by the automations.
- The Translation extension logs the AI requests and responses.
Logs Settings
The logs settings can be found under Settings > Plugin Configuration > Logs.
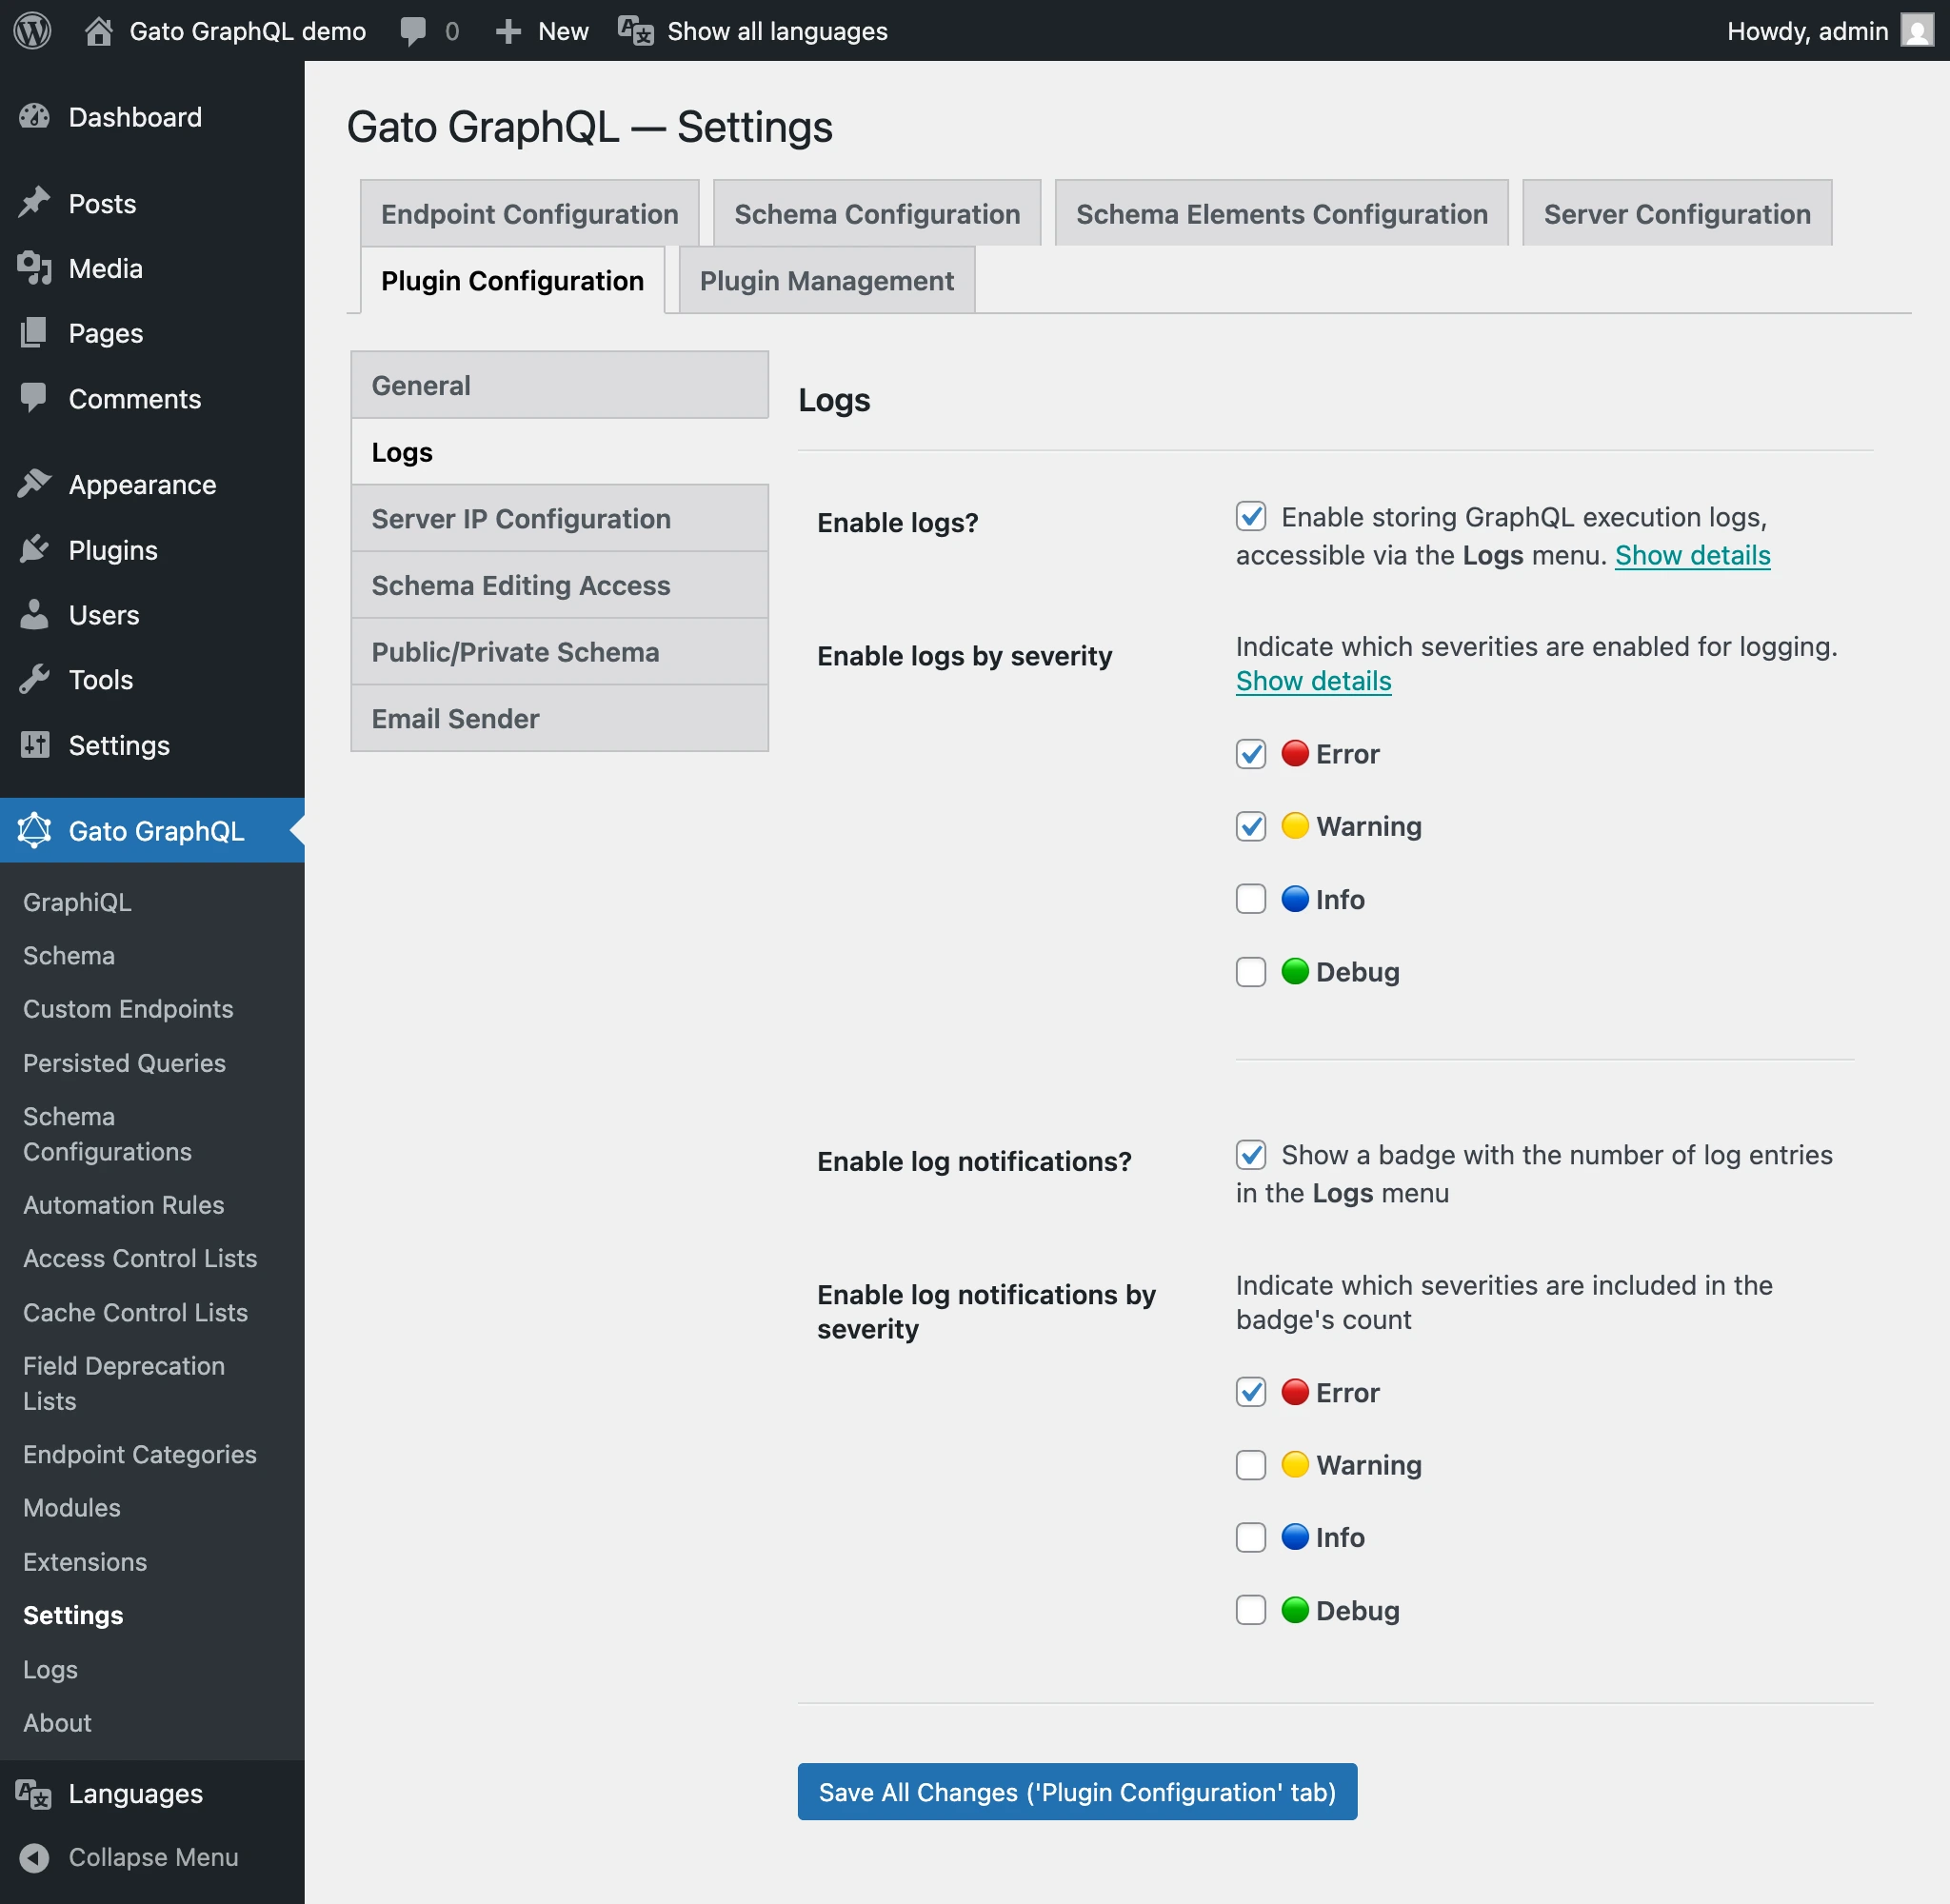
In the Settings, we can configure:
- Enable/disable logging and notifications (both enabled by default)
- The severities that will be logged (🔴 Error and 🟡 Warning by default)
- The severities that will trigger a notification (🔴 Error by default)
Log Severities
There are 4 severities:
| Severity | Description |
|---|---|
| 🔴 Error | Critical issues that prevent the operation from completing |
| 🟡 Warning | Non-critical issues that may affect the operation |
| 🔵 Info | General information about the operation |
| 🟢 Debug | Detailed information for debugging purposes |
Notifications
Whenever an entry (for any of the configured severities) is added to the logs, a notification badge will be displayed in the plugin menu (both under the plugin name, and under the Logs menu item).
This is useful to track why queries (executed via the Internal GraphQL Server or the Automation extension) have failed.
Accessing the logs
The logs can be accessed by clicking on Logs in the plugin menu:
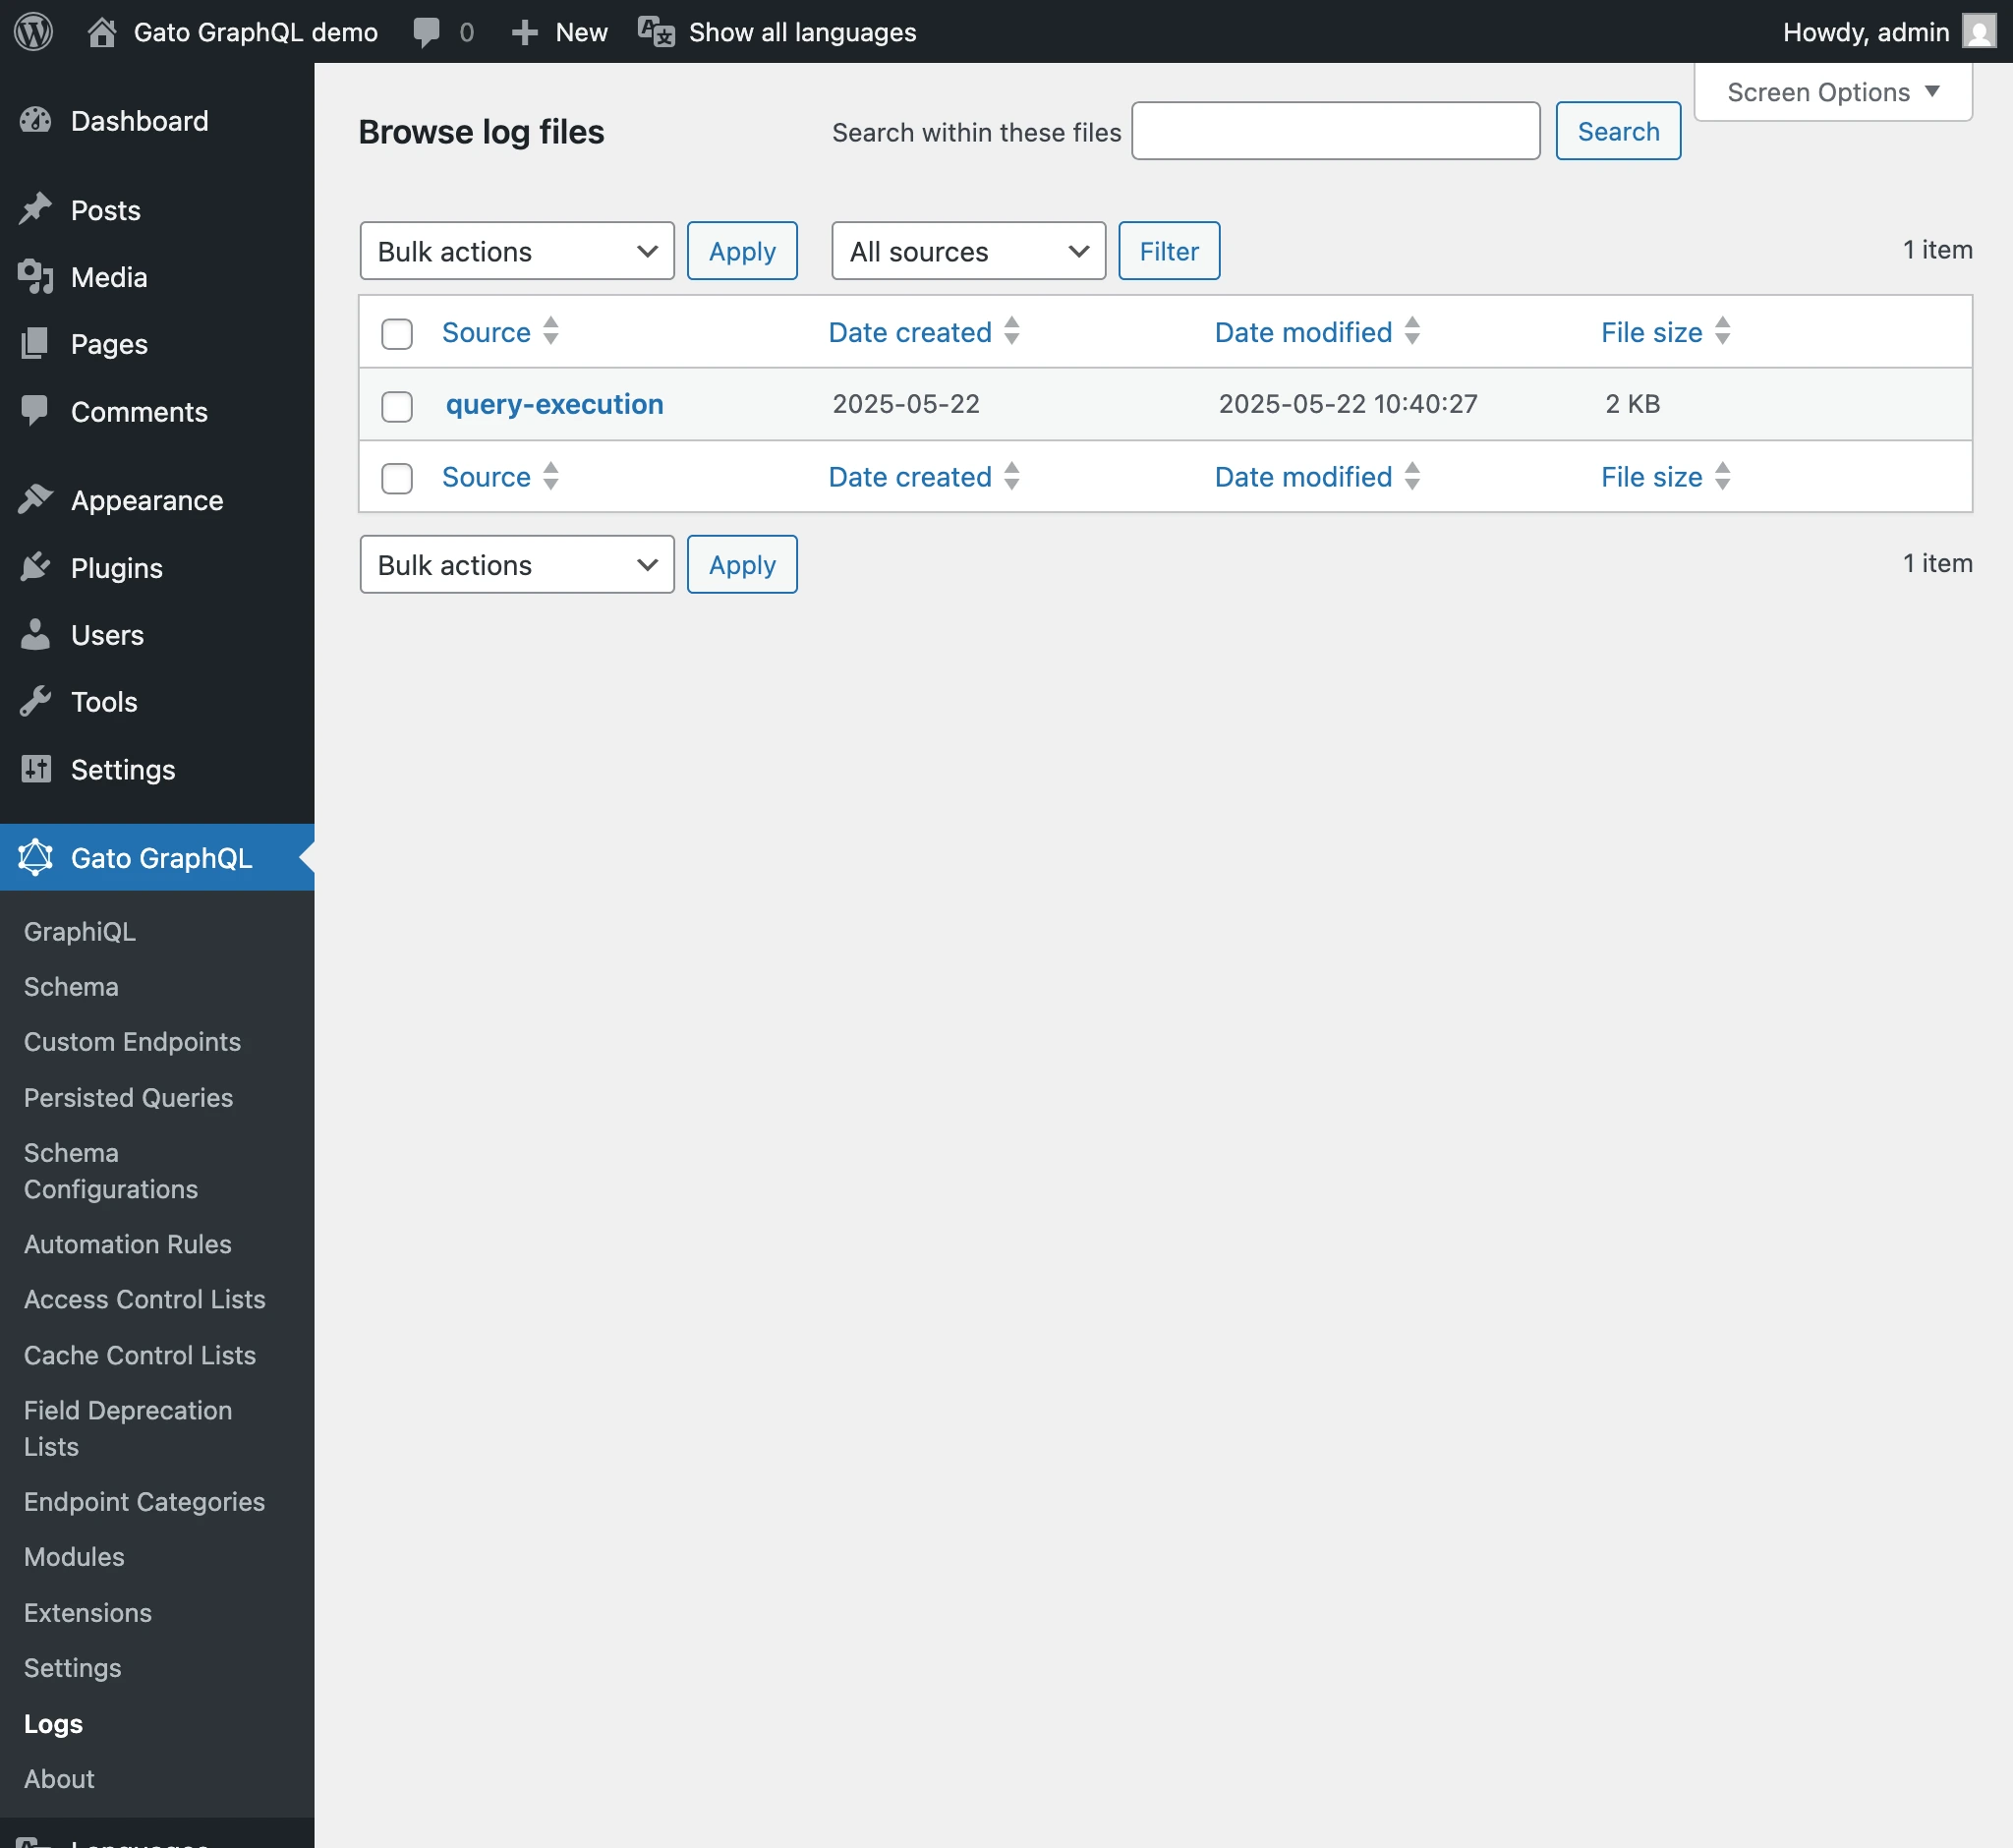
Clicking on a log entry can visualize that log in detail:
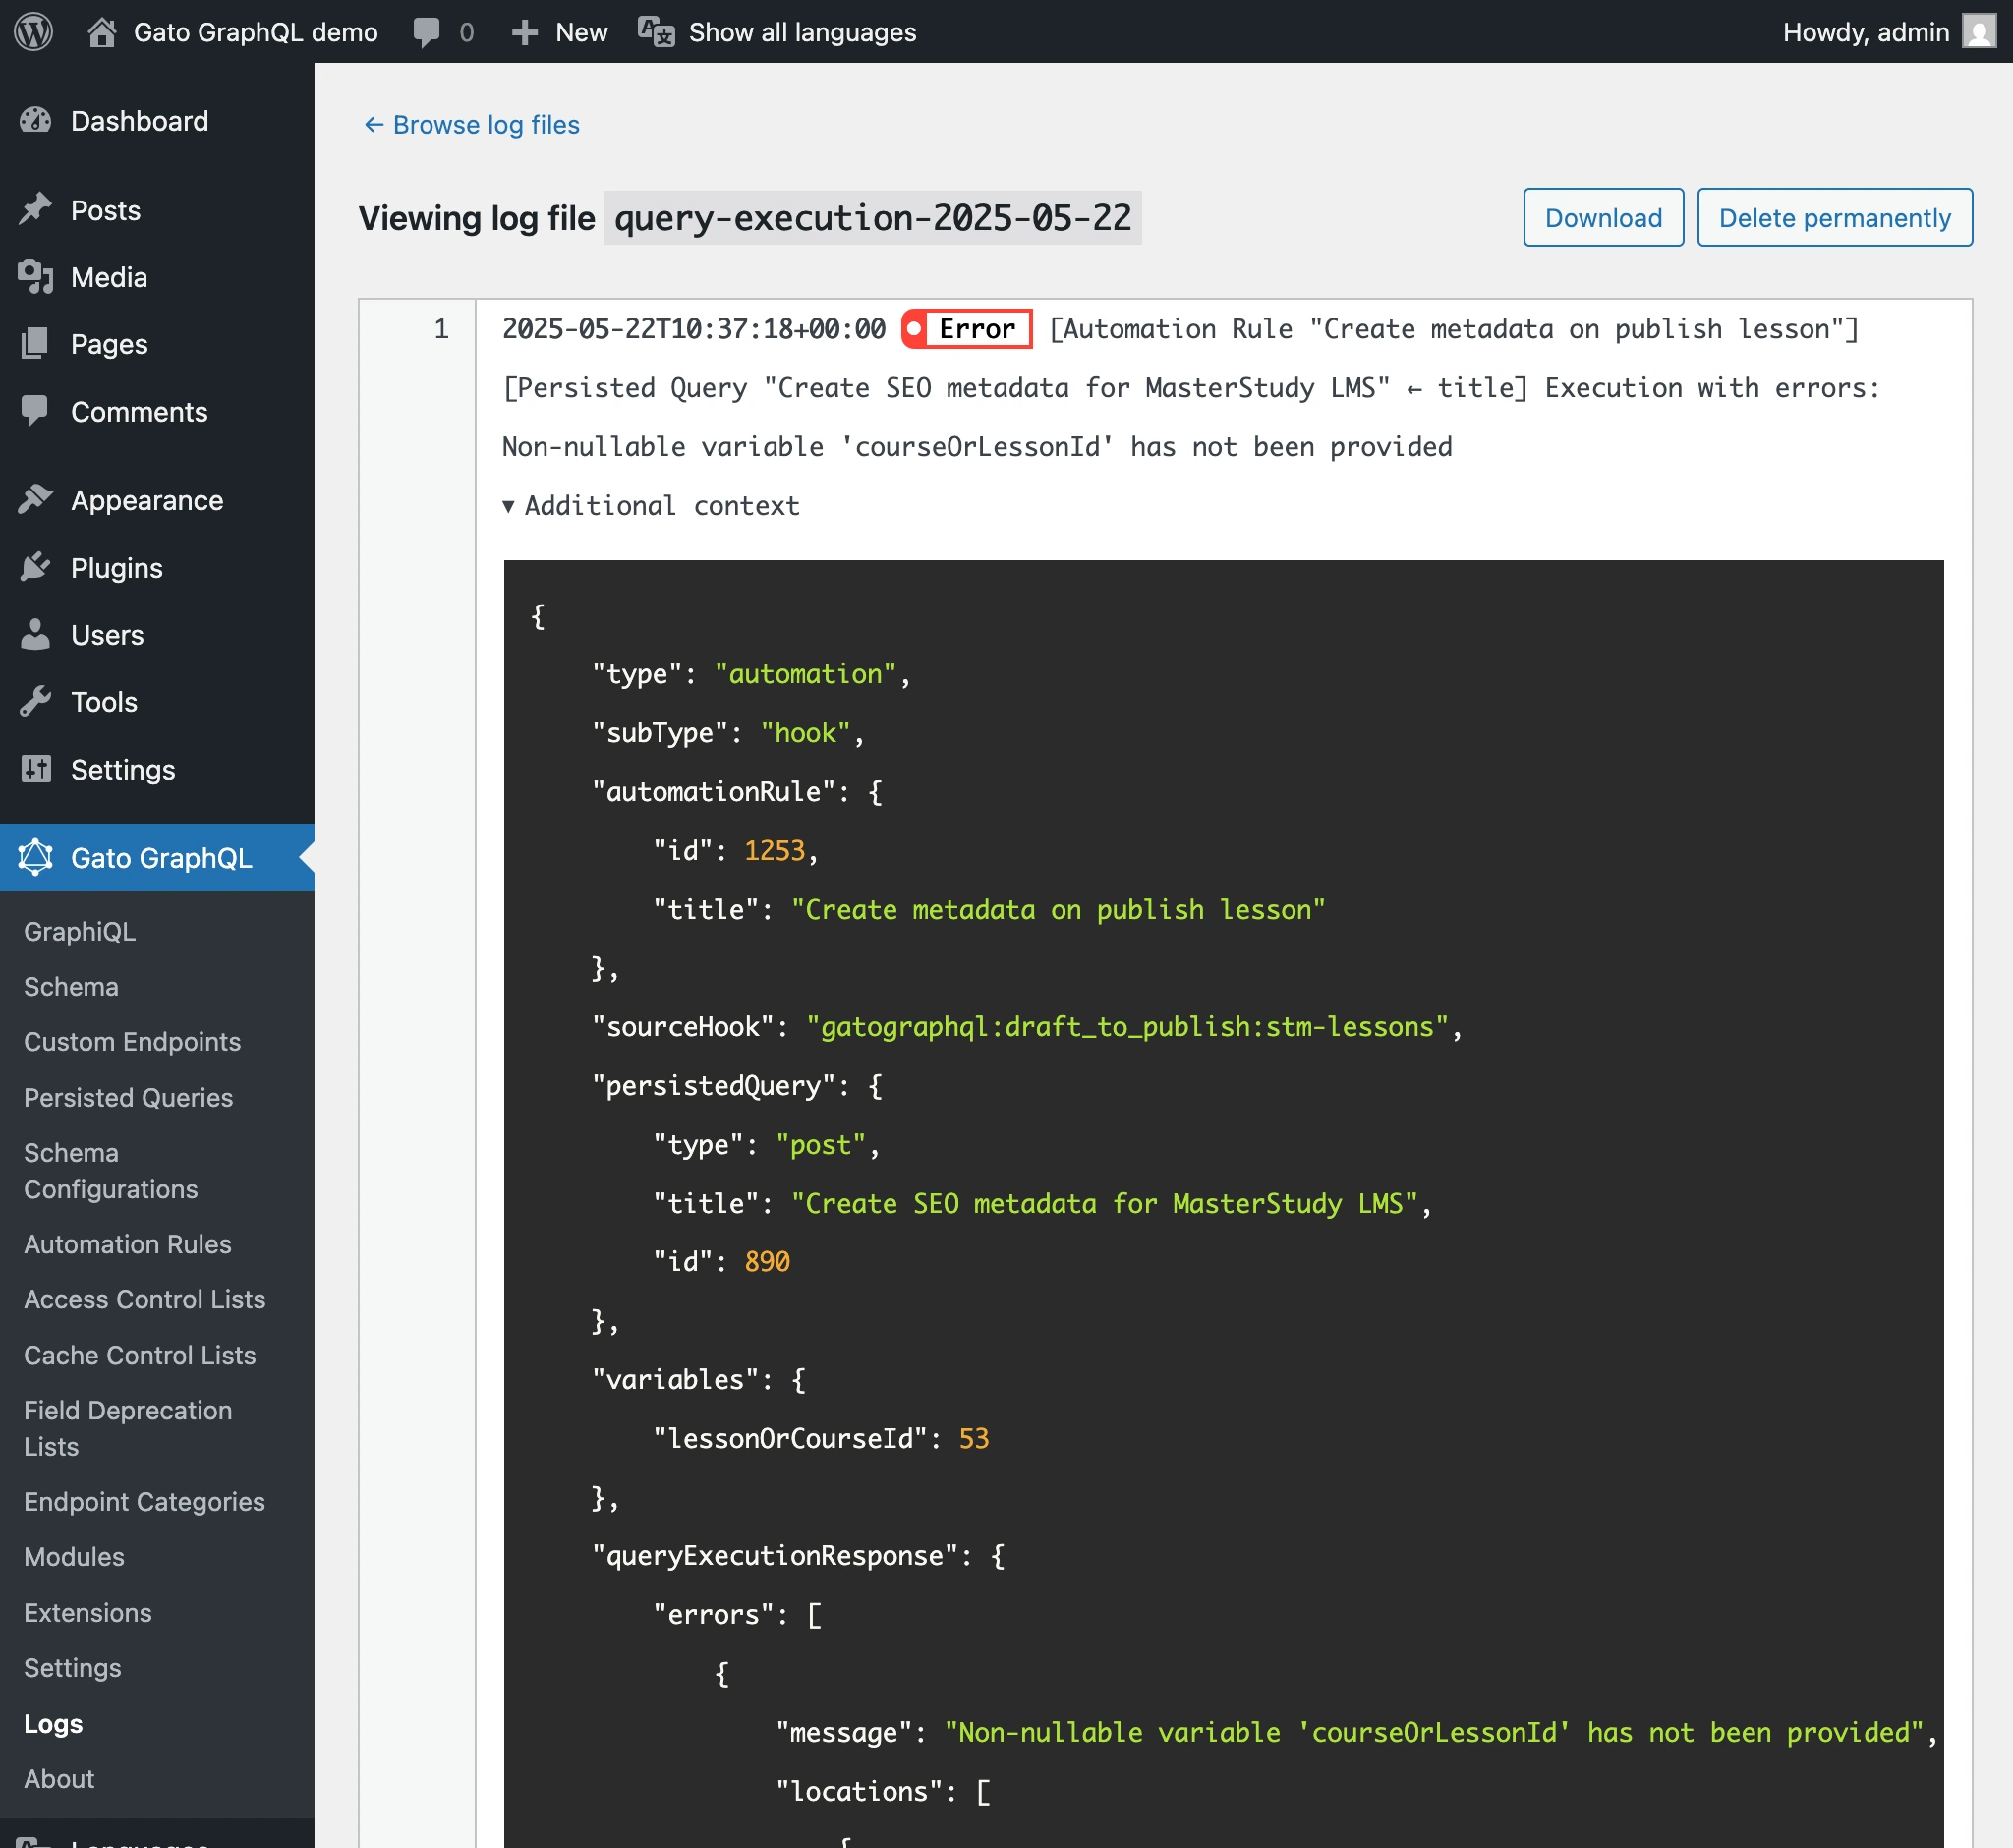
On the log details, clicking on the Download button will download the log file.
Maintaining the logs
To prevent logs from consuming excessive disk space, it's recommended to periodically clear them.